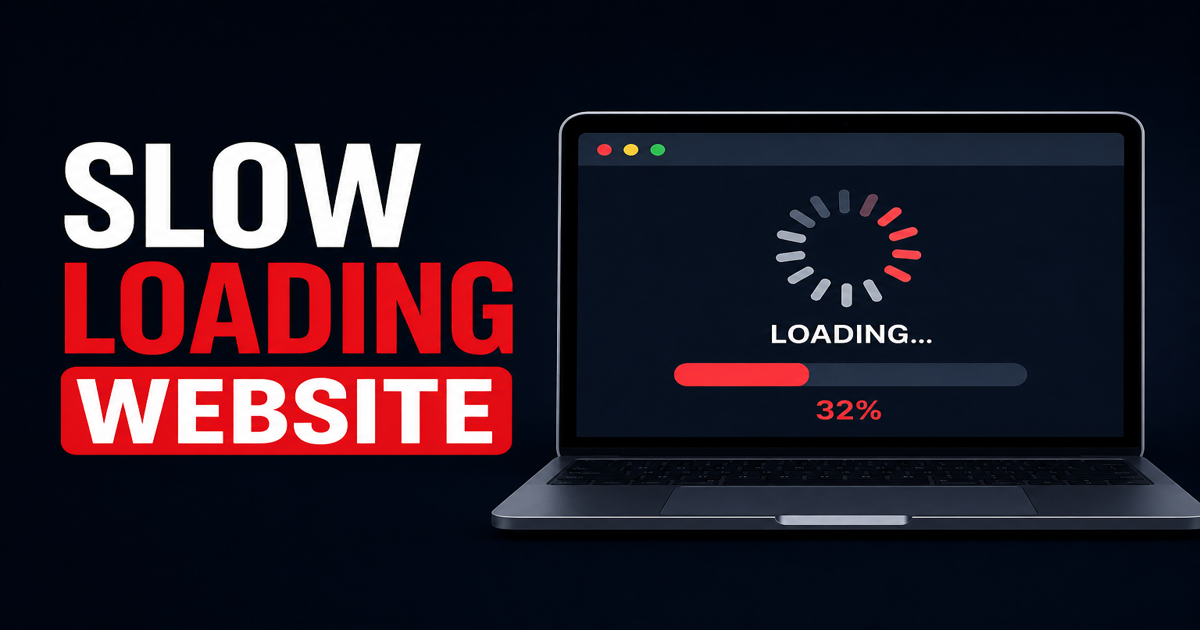
How Slow Loading Pages Damage Your SEO
Mubashira
·7 min read
Want to know if your site has this issue? Run a free technical SEO audit and get results in minutes.
Run a Free SEO Audit →Key Takeaways
- Slow loading pages directly reduce Google rankings due to Core Web Vitals signals.
- Even a one-second delay can reduce conversions by up to 7%, costing real revenue.
- Most speed problems trace to large images, render-blocking scripts, or slow server response.
- Google's PageSpeed Insights and CrWUX data are your starting points for diagnosing issues.
- Regular speed audits via SEO Reporty catch regressions before they damage your rankings.
You've written great content. Your on-page SEO is tight. You've earned solid backlinks. Yet your rankings are plateauing — or worse, slipping. If this sounds familiar, your slow loading website might be quietly undermining everything else you're doing right.
Page speed is no longer a "nice to have" — it's a ranking factor, a conversion driver, and a direct signal of user experience quality. This guide breaks down exactly why slow loading pages hurt your SEO, what causes them, and how to systematically fix the problem.
Why Slow Loading Pages Are an SEO Problem
Google's Core Web Vitals make speed a ranking signal
Since Google's Core Web Vitals update rolled out as a confirmed ranking factor in 2021, page experience signals have been baked into how Google evaluates every URL. Three metrics sit at the centre:
LCP (Largest Contentful Paint) — how quickly the main content loads. Target: under 2.5 seconds.
FID / INP (Interaction to Next Paint) — how fast your page responds to user input. Target: under 200ms.
CLS (Cumulative Layout Shift) — visual stability during loading. Target: under 0.1.
A slow loading website fails LCP almost by definition. Google collects real-world data on these metrics via the Chrome User Experience Report (CrUX) and uses it to inform rankings — meaning slow pages face a measurable organic disadvantage against faster competitors.
Slow pages increase bounce rate, which compounds the damage
Google's own research found that as page load time goes from 1 to 3 seconds, the probability of bounce increases by 32%. By 5 seconds, that number jumps to 90%. High bounce rates send negative engagement signals back to Google, reinforcing that your page isn't satisfying user intent — which puts downward pressure on rankings over time.
The relationship is self-reinforcing: slow loading leads to poor experience, which leads to lower dwell time and higher bounce, which weakens your rankings, which reduces traffic, which reduces revenue available to invest in performance improvements.
The Real Business Cost of a Slow Loading Website
Conversion rates drop measurably with each added second
Speed isn't only an SEO concern — it's a revenue concern. Industry benchmarks consistently show that every additional second of load time costs conversions. Research from Portent found that a site loading in 1 second converts 3× better than one loading in 5 seconds. For e-commerce businesses, even a 100ms improvement can produce measurable revenue gains at scale.
Mobile users are hit hardest
With mobile-first indexing now the standard for all new websites, Google evaluates your mobile performance as the primary signal. Mobile connections are inherently more variable than desktop broadband, meaning slow loading pages create a worse experience for a larger proportion of your audience. A site that loads in 2 seconds on fibre may still feel sluggish on a 4G connection in a low-signal area.
Pair mobile performance analysis with your SEO audits to ensure mobile LCP, INP, and CLS are meeting Google's targets — not just desktop scores. You can run both in one workflow using SEO Reporty's site audit tool.
What Actually Causes Slow Loading Pages
Unoptimised images are the most common culprit
Images are typically the largest assets on any web page, and uncompressed or oversized images are the single most common cause of slow loading. A product photo uploaded at 4MB when it only needs to render at 400px wide is pure wasted bandwidth. Modern formats like WebP and AVIF deliver the same visual quality at 25–50% smaller file sizes than JPEG or PNG.
Practical tip: audit every page's image weight using your browser's DevTools Network tab. Filter by "img" and sort by file size. Any image over 200KB should be investigated. A properly optimised hero image should rarely exceed 80–120KB for most use cases.
Render-blocking JavaScript and CSS
Browsers must parse HTML, CSS, and JavaScript before rendering a page. Scripts loaded in the <head> without async or defer attributes block the entire render pipeline — meaning your user stares at a blank screen while a third-party analytics tag or ad script loads. This is a fixable architectural problem, not an unavoidable trade-off.
Audit your third-party tags regularly. A Tag Manager audit often reveals orphaned or duplicate scripts that were added years ago and never removed. Each one adds latency.
Slow server response (TTFB)
Time to First Byte (TTFB) measures how long it takes the server to start sending data to the browser. A TTFB above 800ms is a red flag. Common causes include under-resourced shared hosting, uncached database queries, and missing server-side caching layers. If your TTFB is slow, no amount of front-end optimisation will fully compensate — the problem is upstream.
Consider a CDN (Content Delivery Network) to serve static assets from edge nodes closer to your users. For dynamic content, implement server-side caching at the application layer. These changes can reduce TTFB from 1,500ms+ to under 200ms on well-optimised stacks.
Excessive page weight and third-party bloat
Total page weight — the sum of all HTML, CSS, JS, images, and fonts — has a direct relationship with load time. The median desktop page now exceeds 2MB; many e-commerce and editorial sites push 5MB or more. Third-party scripts (chat widgets, social embeds, retargeting pixels) are major contributors, and they are often outside your direct control.
Conduct a third-party script audit quarterly. For each script, ask: is it actively used, does it justify its weight, and can it be loaded conditionally (e.g., only after user interaction)? This single audit step routinely surfaces 300–600KB of removable payload.
How to Audit and Fix Your Slow Loading Website
Start with a structured site speed audit
Before you start fixing, you need a clear picture of where the problems are. A structured audit captures LCP, CLS, INP, TTFB, and total page weight across multiple URLs — not just your homepage. It's common for inner pages (product pages, blog posts, category pages) to have significantly worse scores than the homepage, which tends to receive the most optimisation attention.
Use Google's tools as your baseline
Two free tools give you the data Google itself uses to evaluate your pages:
PageSpeed Insights — provides both lab scores (Lighthouse) and field data (CrUX) for any URL. Start here.
Google Search Console's Core Web Vitals report — shows URL-level failures at scale across your entire site, categorised as Good, Needs Improvement, or Poor.
Address "Poor" URLs first, as these are the pages most likely to be actively disadvantaged in rankings. Work through "Needs Improvement" URLs next as a preventive measure. Explore more technical SEO insights on the SEO Reporty blog.
Build speed into your ongoing SEO workflow
Page speed is not a one-time fix. Every new plugin, image upload, third-party script, and theme update is a potential regression. Teams that treat speed as a quarterly audit item — rather than a continuous monitoring concern — frequently discover that their hard-won improvements have eroded six months later without anyone noticing.
Set speed performance budgets (e.g., LCP must stay under 2.5s, total page weight under 1.5MB) and integrate automated speed checks into your deployment process or monthly SEO reporting cycle. Regressions caught early take hours to fix; regressions discovered after months of lost rankings take weeks to recover from.